Share this content:
Resistance: a key – yet underestimated – parameter of BESS energy efficiency
The importance of understanding resistance
Resistance is often an overlooked variable in monitoring the performance of batteries because it is not directly measured by the BMS. What a shame, given that it quietly yet critically influences asset performance and safety in the short and long run. Proper tracking of resistance evolution can hence unlock opportunities to boost both asset efficiency and longevity.
What exactly does “resistance” mean for batteries? How does it work and how does it impact asset performance? How should it influence the asset management strategy? Let’s find out!
Battery internal resistance: a “halting” force with many faces
Internal resistance of a battery is the inherent opposition to the flow of electric charge.
- A certain proportion corresponds to the resistance of electric current flow through conductive internal or external materials (called “Ohmic Resistance”).
- Another component of this internal resistance, dynamic as we will later explain, is known as “polarization resistance“: it corresponds to the difficulty encountered by ions when moving through the electrolyte and across the active layers of the electrode, just like the effort you would need to expend in order to swim through water.
The very existence of this persistent internal resistance is the source of two main limitations when applied to real-life energy storage (like BESS):
– At the cell level, a bit of energy is inevitably lost during both charging and discharging (see figure 1), corresponding to the “effort” for lithium-ions to diffuse in electrolyte and insert within the electrode’ material layers mentioned above.
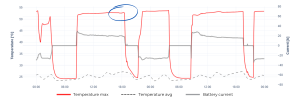
– Zooming out to the module level, this resistance plays an even more deceptive role. It can prematurely halt charging cycles, a hiccup often caused by the BMS misinterpretation of voltage signals. Indeed, remember that Voltage (U) = Resistance (R) x Current (I) + OCV, which means that maximum voltage may be reached sooner than expected due to resistance. This tricks the BMS into thinking the battery is fully charged when, in reality, it could have stored more energy.
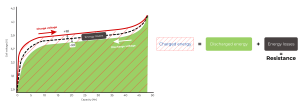
Figure 1: voltage vs. capacity
When high resistance means lower asset performance
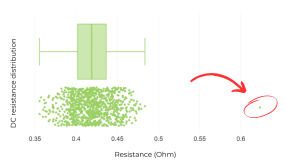
In the field, a high resistance has several impacts on the battery performance namely; the system’s overall energy efficiency.
Impact on performance
On one hand, high resistance leads to energy loss as heat, meaning that less energy (Wh) are returned to the grid upon discharging than was initially charged—resulting in lower range for electric vehicles and reduced revenue potential for BESS. This occurs even at identical SOH; as resistance increases, the energy actually available declines. Much like tracking a BESS’ SOH (for capacity loss), monitoring for increased levels of resistance resulting in energy loss has a direct impact on the amount of energy available to deliver.
A typical Li-ion battery’s energetic yield spans between 80-95%*, a quite large interval that translates into even wider performance differences if left unchecked.
On the other hand, high resistance limits the maximum current that can be drawn from the battery, thus reducing the maximum available power (W) for significant and sudden power needs (e.g. a dynamic EV acceleration).
Impact on safety
Beyond performance, it’s the asset’s safety that can be compromised with an excessive resistance.
High resistance means additional heat, which can escalate into overtemperature, a well-known (and obvious) cause of thermal runaway. High resistance can also indicate a risk of plating; the increase in resistance is often due to the growth of the SEI (Solid Electrolyte Interface) layer which also makes the insertion in the negative electrode more difficult, facilitating further plating. Once again, lithium-plating is a proven risk factor of incident.
*Research Lab tests results
Resistance dynamics: managing short-term fluctuations and long-term alterations
To make things even trickier, resistance is subject to change, with variations shaped by both immediate operational conditions and underlying structural shifts.
Short-term fluctuations momentarily alter a battery’s resistance:
- Resistance varies with SOC: resistance is higher than usual when the electrodes are fully lithiated; meaning at high and low SOC.
- Temperature also plays a crucial role; in colder conditions, ions mobility through the electrolyte is hindered, causing a temporary spike in resistance that normalizes as temperatures increase.
Structural changes bring more enduring challenges. Battery aging gradually increases resistance as the battery’s internal components wear down, leading to a slow decline in performance. Cell failures, whether from initial quality variations or operational stress, further aggravate resistance issues.
With internal resistance of each cell subject to change, there is a risk that those changes don’t occur homogeneously and that imbalances arise. Such resistance dispersion can then lead to inhomogeneous aging, or even to a risk of overvoltage/undervoltage
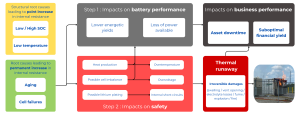
Figure 2: Increase of the resistance: impacts on the battery ecosystem
Practical solutions? Monitor resistance and discriminate
Given its evolving nature, monitoring the resistance’s changes over time yields significant value to read through it early signs of performance decline or safety risks. All of this is done with a different lens not directly provided by BMS data (see our Use Case below). More importantly, this becomes particularly relevant when combined with other metrics like SOH to get a handle on the actual energy of the asset, how it is impacted by battery aging and how in turn it impacts the owner’s business case.
You may be interested in the following articles
- Safeguarding Battery Storage: AI-Driven HVAC Anomaly Detection
- Time is money: The importance of fast and efficient battery analytics onboarding
- Resistance: a key – yet underestimated – parameter of BESS energy efficiency
- Battery Management System (BMS) vs Battery Analytics
- The challenges of evaluating State-of-charge (SoC) for battery assets