Share this content:
NMC vs LFP: safety and performance in operation
Introduction: NMC a tried and tested EV chemistry.
LFP, chemical steadiness & affordability…an evaluation
Lithium-ion battery technology is based on the concept of charge and discharge through electrochemical reactions that occur between a positive electrode composed of materials capable of inserting/removing lithium ions. Despite the broad palette of combinations possible within the lithium-ion battery family, negative electrodes are typically based on graphite (C), and two chemistries stand out from the competition for the positive electrode: Nickel Manganese Cobalt (NMC) and Lithium Iron Phosphate (LFP).
NMC batteries have been first widely used to respond to the sudden and exponential demand of Electric Vehicles (EV) and stationary Battery Energy Storage Systems (BESS). In fact, the high energy density, high power availability and low temperature performance of NMC cells made it at first glance the perfect candidate for such applications. However, this exponential number of produced batteries came with an increasing attention to battery safety. In recent years, fire and thermal runaway incidents within battery-powered systems have been frequently reported – have a look for instance at EPRI battery fire tracking list.
LFP on the other hand, has had mild growth until a few years ago. The lower energy density but chemical steadiness when it comes to safety risks made it a reasonable alternative to NMC cells. The case for replacement was made all the more convincing as LFP was more affordable for large batteries fleet operators until 2022 surging critical metal prices.
- What about actual NMC & LFP performance and safety in operation?
- Is LFP really safer than NMC?
- How reliable is a BMS when measuring these batteries degradation and State-of-Charge (SOC) evolution?
In this article we will dig deep to understand the secrets of the NMC & LFP battery chemistries.
NMC & LFP: Performance
It is well-known that NMC has a higher energy density than LFP. The figure below presents the measurements of volumetric and specific energy measured on a large number of cell references tested in laboratories by our long-standing technical partner CEA-Liten1. It confirms NMC’s higher energy density (with its various stoichiometries not distinguished here) compared to LFP. We can also observe a certain overlay of the performance of certain cells of these two chemistries around 150 Wh/kg. The highest densities are clearly obtained with NMC cells, which today reach up to around 275 Wh/kg. If we focus on the major trends, we can highlight an energy density range from 90 to 130 Wh/kg for LFP chemistry and from 190 to 260Wh/kg for NMC ones.
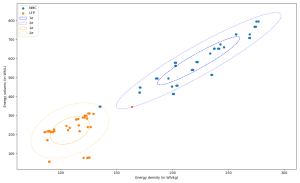
Figure 1. Energy densities of various LFP and NMC cells: volumetric energy density as a function of energy density also called specific density; source: [CEA-Liten].
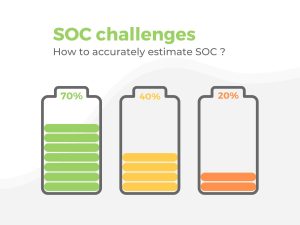
EV or BESS optimal sizing and operation strategies rely heavily on accurate estimates of battery capacity degradation and SOC over time. To estimate a battery SOC, Battery Management Systems (BMS) measure its voltage – or filling height of the battery – and the current – charge or discharge flow rate. If these measurements are likely to be consistent for Lab conditions SOC estimation, it is far from acceptable when it comes to actual field battery operation. One of the tricky parameters in operation is the voltage trend evolution and its interpretation. A major advantage of LFP cells is their stability when it comes to available power: regardless of their SOC, LFP batteries provide a constant power output. The issue is that a constant power output also means a continuous and flat voltage curve.
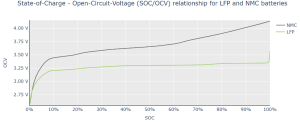
Figure 2.a. Open Circuit Voltage (OCV) of a LFP and a NMC cell in function of their State-of-Charge (SOC).
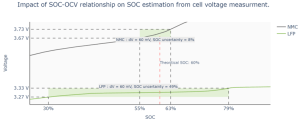
Figure 2. b. Impact of an uncertainty of 60 mV on SOC estimation for both cells; source: [PowerUp].
Figure 2.a. describes the behavior of both LFP and NMC cells in function of their SOC in an Open Circuit Voltage (OCV)1. We can clearly see the very flat voltage behavior of the C/LFP chemistry i.e. slope < 1 mV/%SOC between 35% and 95% SOC. By contrast, the C/NMC chemistry exhibits two successive slopes:
- A slope in the range of 3-9 mV/%SOC between 25% and 65% SOC;
- Another slope >9mV/%SOC from 65% to 100% SOC.
These differences in voltage trends have a direct impact on the SOC estimation uncertainty. Figure 2.b. shows that, at the same dV, SOC estimation uncertainty for the NMC cell is around 8% and 49% for the LFP one. In fact, it is hard to accurately measure a LFP cell voltage evolution during its quasi non-changing phase. The slightest voltage measurement error during this phase could lead to SOC aberrant estimation.
Now, imagine measuring the same values in a polluted battery application use-case such as electric buses in operation or energy shifting Battery Energy Storage Systems (BESS). An application with no OCV makes it even harder to accurately estimate a LFP battery SOC. Many of our clients operating LFP batteries used to struggle with SOC estimation, often leading them to energy loss, as well as recurring and costly maintenance. More complex approaches for the estimation of the SOC are therefore needed for LFP cells, typically based on the combination of coulombic method and Kalman filtering.
On another note, if SOC estimation for NMC cells seems to be an easy task, its available power will decrease as the SOC goes down. For this reason, NMC batteries often need to be over-sized, in order to compensate for this phenomenon and still provide a reasonable power at low SOC. This weakness, however, is offset by the higher energy densities of NMC compared to LFP and other chemistries, as shown in the previous figure.
On the other hand, NMC cells can be – in the case of cell-balancing issues due to SOH or SOC dispersion – overused at low SOC levels while the battery is out of power. This kind of situation can lead to critical safety levels, with risks of thermal runaway.
Safety: Thermal runaway tests for NMC & LFC with CEA-Liten
LFP is known to be safer than NMC …
To enrich our battery simulation models and refine our predictive safety algorithms, PowerUp carries out with CEA-Liten thermal runaway tests.
Thermal runaway tests are performed in adiabatic calorimeters, at the cell level. The following graph presents the temperature evolution during such a test on a given cell reference:
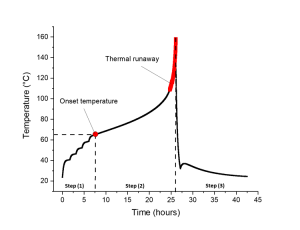
Figure 3. Temperature evolution during an overtemperature test, according to a Heat-Wait-Seek procedure in an adiabatic calorimeter; source: [PowerUp / CEA-Liten].
We can observe on this graph the three consecutive steps:
- Step (1): Heat-Wait-Seek procedure consisting itself in the following steps:
- Heat: increase from ambient temperature step by step, by steps of 5°C;
- Wait: after reaching the T + 5°C, a certain time is maintained, 30 minutes;
- Seek: the equipment detects if there is or not an exothermic reaction of the cell, usually defined by an increase of the temperature > 0.02°C/minute. When detected, this temperature is defined as “onset temperature of the thermal runaway phenomenon”.
- Step (2): the equipment stops the Heat-Wait-Seek procedure and monitors only the exothermic reaction up to a certain level of temperature, here up to 160°C, to observe in detail the thermal runaway reaction behavior. The most critical behavior, here underlined in red, corresponds to a temperature increase > 0,2°C/min;
- Step (3): stop of the thermal runaway phenomenon thanks to a decrease of the temperature driven by the equipment itself.
Figure 4. shows onset temperatures of a fairly wide range of cells and cells density. It is important to note that the figure mentions cells of different formats (cylindrical, pouch, and prismatic cells) and different types (energy & power cells type).
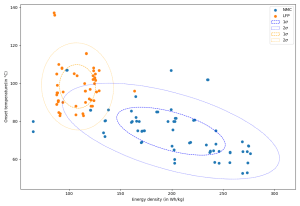
Figure 4. Onset temperature of various LFP and NMC cells as a function of their specific density; source: [CEA-Liten].
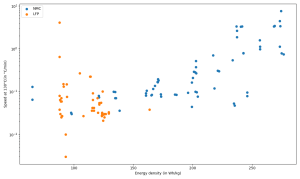
Figure 5. Temperature increase speed of various LFP and NMC cells as a function of their specific density; source: [CEA-Liten].
On the one hand, we can see that, globally, the higher the energy density, the lower the thermal stability of the cells. Consequently, C/LPF cells tend to reach thermal runaway level later than C/NMC ones. On the other hand, Figure 5. clearly shows that the rate of temperature change during a thermal runaway, observed at 130°C, increases with the energy density. As a result, C/LFP cells tend to run away less violently than C/NMC ones. However, we can point out that both NMC and LFP cells are subject to thermal runaway phenomenon, and not intrinsically protected against it as it is suggested by some.
Also, due to the voltage range of NMC cells compared to LFP cells (see Figure 2), NMC chemistry is more likely to experince to the Li-plating. It is important to highlight however that LFP chemistry is not fully protected against Li-plating phenomenon.
Reminder: the Li-plating phenomenon is related to the negative electrode potential reached during the charge: under high charge C-rate and/or low temperatures and/or high SOC, this potential is likely to reach a voltage value lower than the standard reduction potential of Li+| Li, and then lead to the formation of lithium metal.
… except when it comes to cell balancing issues
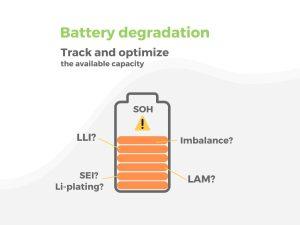
Cell imbalance – dispersion of cells (or strings of cells) associated in series – could stem from various parameters. As mentioned below, what concerns us in this article is the potential dispersion of SOH or SOC.
Learn more about cell-imbalance
In fact, dispersion of SOH or SOC is a result of malfunctions that may arise from the manufacturing process, or due to temperature fluctuations; and on the other hand, simply to cell self-discharge. Cells may experience slightly faster degradation or discharge compared to others and lead to a disparity in degradation or charge level between cells.
The purpose of the BMS cell balancing system is to compensate for these SOC dispersions. However, in most cases involving LFP cells, SOC dispersion is not even detected due to the inoperable flat voltage behavior. Hence, it limits the useful capacity, leading to over-charge/over-discharging, and consequently, to battery fire risks.
When it comes to SOH dispersion, BMS alone is helpless whether for NMC or LFP cells. The loss of useful capacity can lead to over-charge / under-discharge the defective cell / string of cells. It is thus highly recommended to replace the defective module whenever detected by Battery Insight®, since the BMS cell balancing system is not at all able to compensate such kind of dispersion.
Beyond safety concerns, cell imbalance can also – depending on the usage profile – directly impact the available capacity. In fact, significant cell imbalance cases can lead to a loss of capacity due to a limiting string of cells that prematurely stops the charge while most of the pack is not fully charged – or stops the discharge while most of the pack is not fully discharged, respectively. “Battery degradation” article tells you all you need to know about it.
Conclusion: An evaluation of NMC and LFP for performance & safety
Performance
- Complex approaches – based on the combination of coulombic method and Kalman filtering – are needed to accurately estimate a LFP battery SOC.
- NMC cells can be – in the case of cell-balancing issues due to SOH or SOC dispersion – overused at low SOC levels while the battery is out of power.
Safety
- Generally speaking, NMC cells are less stable than LFP and more subject to thermal runaway.
- However, LFP batteries are prone to cell imbalance issues and associated safety risks, while safety incidents in NMC cells are more likely to stem from Li-plating phenomena.
1. PowerUp is a spin-off CEA-Liten, one of the major research Institutes in Europe for new energy technologies.
2. Open circuit voltage conditions refer to the situation when a voltage source, such as a battery or generator, is not connected to any load, and thus there is no current flowing from the source. It is a relaxed phase in which the battery reaches its chemical equilibrium. As such it is an intrinsic property of each chemistry and is an essential parameter to understand and model cell behavior.