Share this content:
Battery capacity: diagnosis & prediction [Part 1]
State of Health: An important metric for Battery Capacity
A battery’s average lifespan is in the range of 10 years. But will performance be consistent until then? What alterations can be expected?
Why is it trickier than expected to get a precise view of a battery’s state of health when in operation?
What upsides can a close monitoring of this indicator concretely bring?
Ever experienced sudden battery degradation, resulting into a diminished performance compared to its first day of operation? That is because, as dynamic electrochemical bodies, lithium-ion batteries are affected by ageing mechanisms of their own, that translate into capacity loss.
Good news is, this is monitored by a well-known metric we call State of Health (SOH). Yes, health, just like for humans. But for batteries, this “health level” is typically expressed as a ratio between current capacity C(t) and the initial capacity of the battery C(t=0).
An approximate (or potentially completely off-track) SOH is not without consequence: battery operators (be that in energy storage or electric mobility industries) need to rely on this indicator for highly strategic decisions: for example, to optimize resources allocation, define usage strategies, or strike a balance between asset use and battery life preservation…
But there is the rub: there is no easy measurement for the aforementioned “capacity C(t)” in operation, hence making the SOH estimate tricky. Granted, trend lines can be derived from battery datasheet specifications, based on theoretical usage, and standardized profile. That’s often what we have seen to be the default option for battery operators. However, it is key to realize that this method fails to integrate the implications of real usage conditions, requiring in turn additional analytics in order to accurately assess SOH.
Getting old always follows a pattern
Even though it is dependent on usage, batteries typically degrade slowly in the first part of their life: just like the first wrinkles take a few decades to appear on a person’s face, batteries usually lose only a few percents of their capacity in their first years of operation.
However, ageing is a nonlinear phenomenon: at some point, the trend drastically changes, and a steep drop of SOH can be witnessed in a limited time window (several percents in a few weeks). This trend change is called a knee point (see figure 1), and this brutal acceleration of the capacity loss can precipitate the need of maintenance, or even paralyze a whole system if not detected early on.
What’s more, some usage conditions more than others can provoke an acceleration of this ageing process – a double-edge sword whether operators actually have leeway to alter and improve operating conditions.
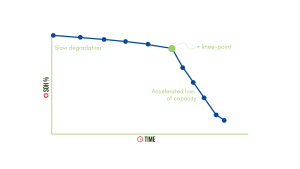
Figure 1. Knee point phenomena: sudden drop in battery capacity
Making a diagnosis
More complex than a routine check-up
Standard traditional diagnosis implies interrupting operations of the battery asset to perform a complete charge and discharge of the asset at a slow rate. But such interruptions are not only time-consuming, they are also costly and cannot be performed at a frequent rate. They also pose a risk of failing to identify a knee point situation (see above).
What then appear to be more convenient (or even necessary) are more frequent, non-intrusive SOH diagnosis on assets in operation. But this poses 2 significant challenges, as the operating assets mostly perform partial charges and discharges in evolving “live” conditions:
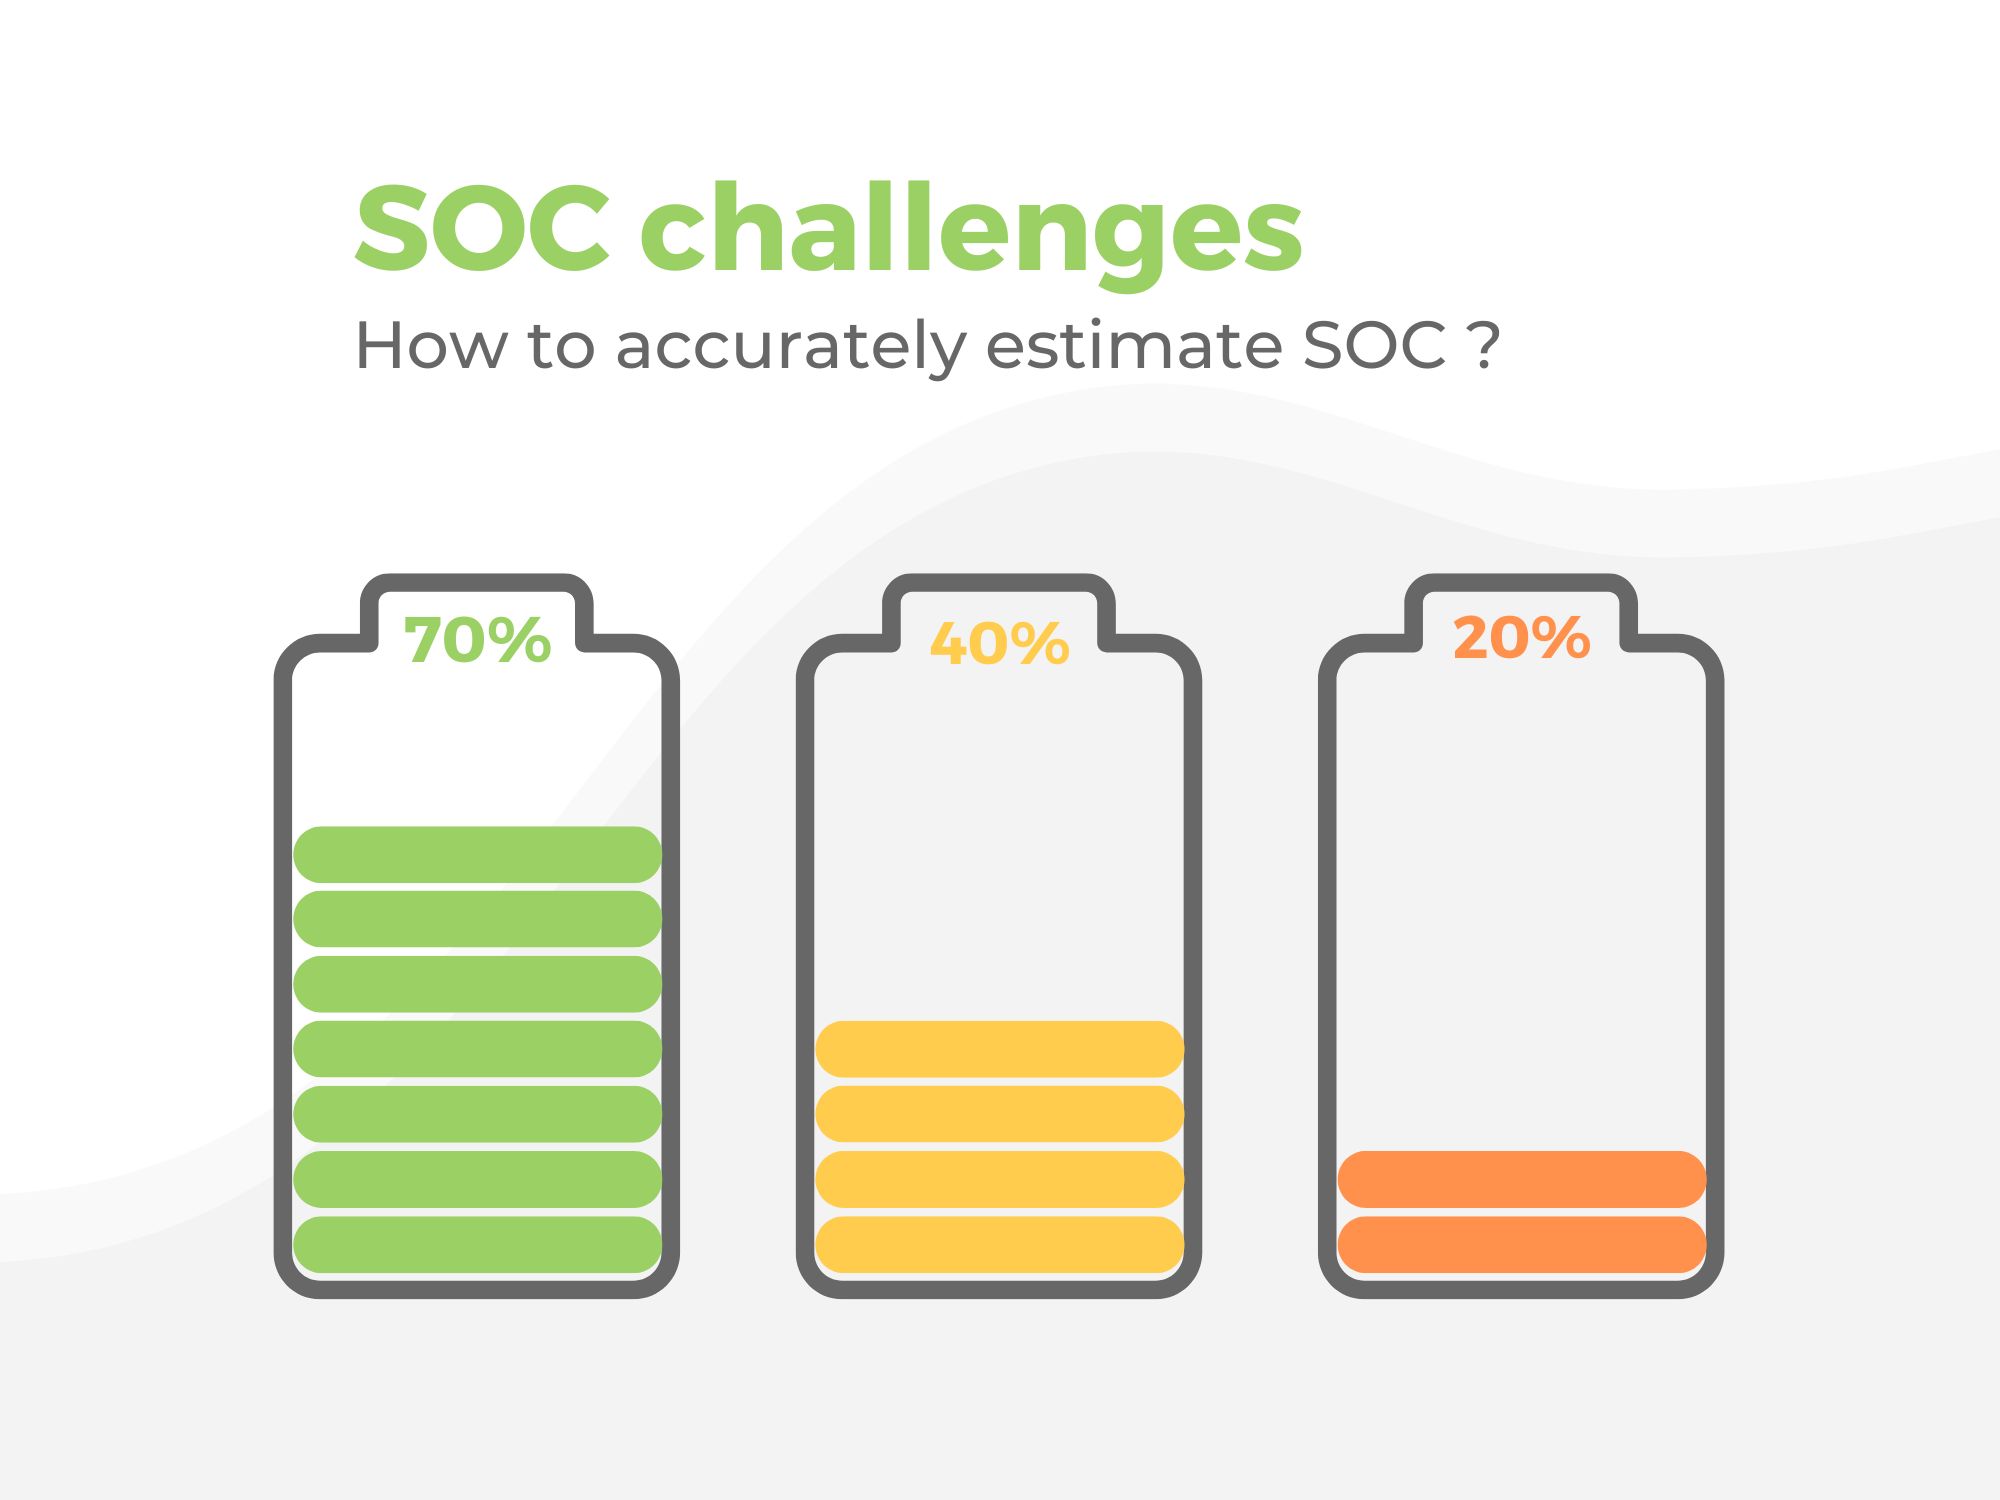
- How to estimate the full energy that can be drawn from a battery if the asset does not operate across the full State-of-Charge (SOC) range? Insights need to be extracted from partial data retrievals.
- How to make comparable SOH estimates although conditions of operations (temperature, current) of the battery are constantly fluctuating? Dynamic behavior needs to be filtered out to focus on the battery’s “static behavior”, usually defined on the manufacturer’s datasheet (e.g 25°C and C/10), that will be used as reference system for any SOH estimate.
Increasingly, battery asset operators have access to Battery Management Systems (BMS) SOH estimations. In this case, the BMS evaluates the SOH by measuring the capacity exchanged on a period of time and comparing it to the evolution of the SOC. Unfortunately, this ratio can be a rough estimate of the SOH, highly dependent on the precision of the measurements.
Good news is, we can raise both hurdles described before by leveraging a combination of tools that go from OCV to specific Incremental Capacity Analysis (ICA). This signature refers to a standard behavior that a cell will have during charge and discharge, that can be represented as a graph of voltage as a function of SOC level.
Knowing that, we can identify and select eligible, partial datapoints of charges or discharges and normalize them to fall back on the “nominal” signature (Figure 2). Thanks to aging campaigns performed in lab, we gained extensive understanding of the full signature of the cells, which means even faced with bits of it we can recognize and rebuild its full range. Electrochemical modelling helps eventually to extract the signature of the cell and allows us to work on its features to identify degradation mechanisms and their impact on the battery performances.
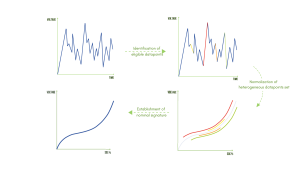
Figure 2. Normalization of a heterogeneous set of datapoints for SOH diagnosis
And as we know how the cell signature evolves as battery degrades, we can ultimately find the correspondence between (1) the “normalized” signature of the cell under study and (2) the associated SOH level.
Eventually, our solution supplements the BMS in multiple ways: it enables precise SOH estimation by filtering possible sensor failures and adds computational power to delve deeper into the data. The analytics also draw from transversal knowledge about battery degradation mechanisms to consolidate the estimations.
State-of-Health (SoH):
Establishing a correct diagnosis is the first step to finding a cure
If you’ve come this far with the article, you are probably wondering “what’s the point” of all this? As mentioned in the introduction, battery operators need to back their operational decisions on asset management with reliable data and indicators, amongst which is the SOH.
Concretely speaking, it gives operators the right tool to:
- Precisely model the financial impact of capacity loss (lowering SOH) on asset performance
- Detect limiting or faulty modules with lower SOH that hinder the overall asset performance à implement part replacements or maintenance
- Pinpoint changes in SOH degradation trend overtime (acceleration, deceleration) & precisely monitor when SOH is getting closer to a critical threshold à anticipate end of first life and potential induced operations (resale of old asset, replacement CAPEX)
- On a more global scale, understand if the current usage conditions are driving an accelerated ageing of the asset à perform tests or changes in usage conditions to slow down degradation and SOH loss and extend asset lifespan (and long-term financial return).
By overcoming the limitations of data availability and leveraging our expertise in battery electrochemistry, PowerUp provides a reliable and precise battery diagnosis solution that empowers operators to optimize battery performance and ensure efficient and sustainable operation in near real time.
From diagnosis to predictions
Accurate and frequent SOH diagnosis is on the other hand, the first step into batteries lifetime prediction. Coupled with advanced modelling methods, it enables the prediction of degradation evolution based on specific usage profiles. This prognosis capability empowers predictive maintenance practices, reducing the impact of operational disruptions.
During the design phase, original equipment manufacturers (OEMs) often provide estimated lifetime information based on theoretical usage or a fixed number of equivalent cycles on a standardized profile. However, our approach goes beyond these static predictions. By leveraging extensive battery aging campaigns and employing stochastic modelling techniques fuelled with machine learning, our method adapts predictions to real-world battery usage patterns, continuously evolving with each new SOH diagnosis.
But enough talking, we’ll tell you more about the importance of capacity loss predictions in the next article!
You can find the next article in this series here.