Turning E-Mobility Battery Data Into Operational Insight

Battery knowledge

Executive Summary

A PowerUp battery audit turns operational data from an e-mobility fleet into a defined set of findings that drive operator action. Below are five categories of finding across audits PowerUp has run on bus and ferry fleets: 

Vehicles with inaccurate State-of-Charge readings. In some cases, the BMS reads 100% SoC while the vehicle continues to accept charge current, indicating a deviation which sometimes exceeds 15%. The audit identifies which vehicles and packs need recalibration.

Uneven State-of-Health across the fleet. For example, in one fleet with five years of operation, SoH averaged around 90% with vehicle-to-vehicle dispersion reaching as much as 8%, the kind of spread that shapes route assignment and inspection priority.

Vehicles operating outside recommended conditions. In two fleets examined under this framework, C-rate exceeeded the operating limit during up to 10% of operating time, causing a potential breach of warranty conditions.

Assets with more useful life than the contract assumes. In two fleets audited under this framework, remaining useful life (RUL) projections came in at 15 years or more, compared to a contract term of 10 years.

In aggregate, the audit shifts maintenance from blanket to targeted, route assignment from calendar-age proxy to condition-based, warranty conversations from anecdote to documentation, and capital decisions from nameplate assumption to projected useful life. The work the BMS and on-board protections do at threshold is unchanged. What changes is what the operator knows before the threshold is reached.

The rest of this article covers the data conditions required to make such an audit possible, and the diagnostic framework that produces the findings.

In E-Mobility Fleets, Analytics Starts With Usable Data

Electric fleets are now a meaningful share of urban transit electrification plans, with maritime electrification advancing in parallel. Lower operating costs, reduced emissions, and improved rider or operator experience all support the case. The economic equation, however, depends on something less visible than the vehicle or vessel itself: the battery, and the data it produces over the asset’s working life.

That data has a long path to travel before it can be analyzed. It leaves the asset over the air, lands at a telematics provider, and then moves into an operator’s fleet management or analytics environment. Each hop introduces variability in what arrives, how complete it is, and how often.

Layered on top of that physical trajectory is a commercial one. Some OEMs share full battery data with their customers. Some share partial data. And some share none at all. Two operators running the same vehicle from the same manufacturer can sit under very different data agreements, and the analytics that are possible for one may not be possible for the other.

The result is that any battery analytics program serving an e-mobility fleet has to start with data and not the algorithm first. Output quality is bounded by input quality, and input quality in fleets is bounded by what the OEM, the telematics layer, and the data agreement allow.

1. The Three Paths to Battery Data in an E-Mobility Fleet

Battery data can reach an analytics environment along three common paths. Each trades completeness, latency, and operator control differently. The descriptions below are framed in road-transit terms, where the standards are most mature; maritime and rail e-mobility operate under their own protocol families.

Path 1: OEM-Embedded Telematics

The vehicle manufacturer collects sensor data, including battery data, to a central manufacturer portal. The operator retrieves what is exposed through an API or similar interface. The OEM’s data agreement determines scope and access.

Path 2: Third-Party Telematics

An aftermarket telematics module taps the vehicle’s interfaces (typically the Controller Area Network bus on road vehicles) and routes data to a sorting backend that makes it available to the operator. Signal coverage depends on what the asset exposes on its interfaces and how the module is configured.

Path 3: Direct Retrieval Through a Fleet-Side On-Board Unit

The fleet operator’s own on-board unit, integrated with its Intermodal Transport Control System (ITCS) or equivalent platform, pulls battery data directly from the vehicle interfaces and forwards it to the operator’s server. The operator controls the data path end to end, at the cost of carrying more of the integration work themselves.

Across all three paths, prefer open standards over proprietary integrations. They keep the analytics ecosystem competitive and reduce the cost of switching. In road transit, the Telediagnostic for Intelligent Garage in Real-time (TiGR) protocol, supported by the ITxPT association, is one such standard. Operators specifying new procurements can reasonably ask OEMs to support whichever framework applies to their domain.

2. Specifying What Data the Analytics Actually Need

Underspecified data requirements drive back-and-forth with the OEM or telematics provider that can stretch over months, and incomplete payloads quietly degrade analytics output. The load-bearing parameters for battery analytics are:

Pack-level current (I), voltage (U), and temperature (T), including minimum and maximum pack temperature, time-synchronized at a granularity appropriate to the discharge and charge profiles of the duty cycle. The min/max temperature readings expose thermal dispersion and the early signatures of cooling or sensor issues.

Cell-level minimum and maximum voltages, which expose dispersion across the pack and allow detection of imbalance-related anomalies that pack-level voltage hides.

State-of-Charge (SoC) as reported by the Battery Management System (BMS), with timestamps of any BMS recalibrations where available.

With these parameters, advanced analytics can detect early-stage deviations such as cell imbalance while the condition remains potentially reversible. Without them, the analytics layer is reduced to confirming what the BMS already shows on the dashboard.

3. Data Cleansing and Processing: From Raw Telemetry to a Usable Dataset

Even when the feed is complete and the parameters are correct, the data is not yet ready for analysis. Three challenges sit between raw telemetry and insight: volume (a large time series from each asset, multiplied across the fleet), BMS measurement reliability (sensor errors that algorithms must not mistake for battery issues), and communication gaps (dropped packets, out-of-coverage assets, telematics provider outages).


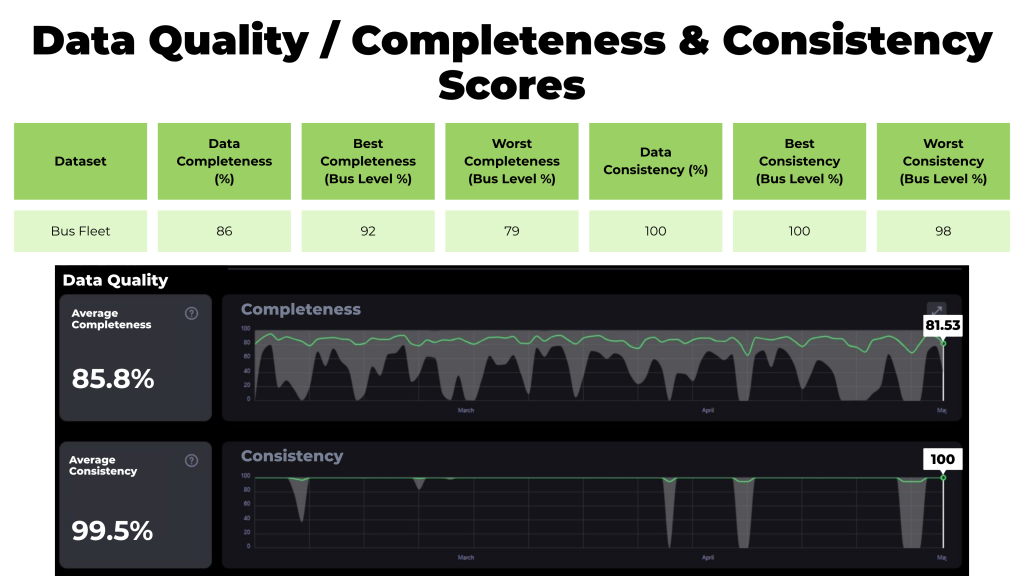
Data quality completeness & consistency scores

Figure 1: Illustrative example of a bus fleet’s data quality/completeness and consistency scores.

The cleansing pipeline filters, standardizes, and labels the field data, removes measurement anomalies, and fills gaps where the battery’s usage profile and behavior make the filled values reliable. The output is a dataset that diagnostic algorithms can run against without inheriting upstream defects.

Battery Insight®, PowerUp’s cloud-based battery analytics platform, is built around this principle: invest heavily in the cleansing layer so that the diagnostic layer has something solid underneath it.

Read more on the importance of building reliable battery analytics through real-world telemetry.

4. What a Battery Audit Examines Through a Diagnostic Framework

A PowerUp battery audit organizes analytics output into a defined set of KPIs and alarms grouped by purpose. The categories work together. The data baseline confirms whether useful analysis is even possible. Safety alarms surface conditions that could escalate toward thermal runaway. Performance KPIs quantify capacity loss and resistance increase. Endurance projects the remaining useful life (RUL) of the battery. Each KPI or alarm is reported at the most granular level the data supports, from fleet down through OEM, vehicle or vessel, pack, and where possible, module.

Safety alarms include over- and under-voltage, over-temperature, cell imbalance, cooling system anomalies, and BMS SoC deviation. Performance KPIs include State-of-Health (SoH) and internal resistance. Remaining Useful Lifetime (RUL) sits in an endurance (or reliability) category of its own.

4.1 Data Baseline: Completeness, Consistency, and Usage Profile

Data completeness and consistency measure whether the data feed is dense enough and physically plausible enough to support analysis. Data completeness in fleet applications is rarely 100%, as data collection naturally pauses when assets are parked, docked, or out of coverage. Average completeness above 80% with near-100% consistency is generally a workable starting point for mobility duty cycles. Worst-asset completeness matters as much as the fleet average, since a single vehicle or vessel with a broken feed cannot be diagnosed.

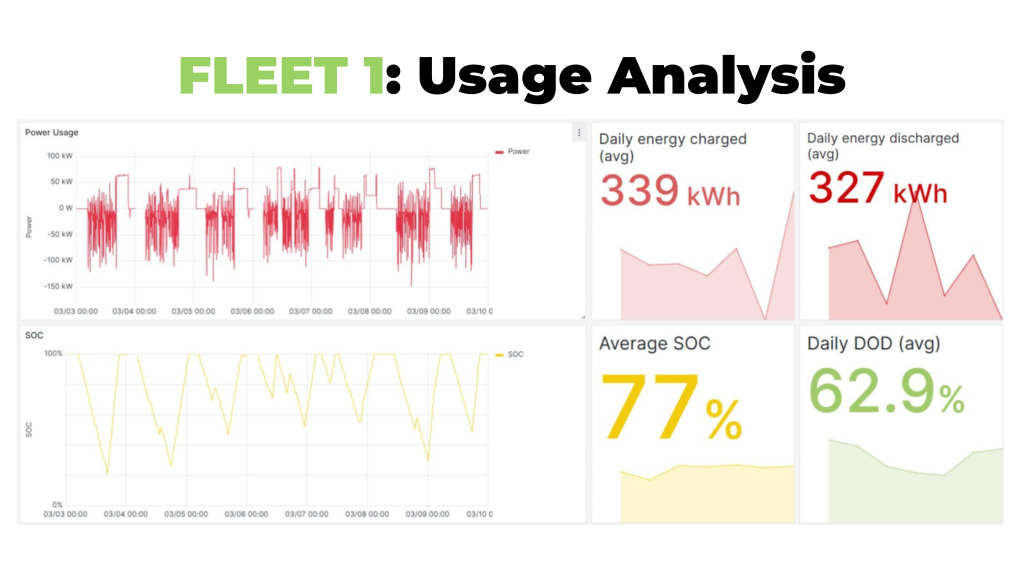
PowerUp fleet usage analysis overview

Figure 2: Usage data analysis from Bus X

Usage shows a daily pattern with “noisy” phase corresponding to the driving phase in the day (here between approx. 5:00 and 17:00), followed by a charging phase with a nearly constant power for 5 to 7 hours. With more than 60% average daily DOD and nearly 330 kWh energy discharged per day, the buses’ batteries are used intensively. On average, 20 cycles per month occur over the period. This usage pattern is typical for electrical public transportation vehicles.

Battery usage analysis characterizes how the fleet actually operates: daily Depth-of-Discharge (DoD), energy throughput, charge and discharge C-rates, charging duration, and cycles per month. This profile is the operational baseline against which all downstream KPIs are read. It also compares observed operating conditions against the OEM’s recommended ranges and warranty thresholds, asset by asset, which is the first point where the audit can flag operating practices that may carry downstream consequences.

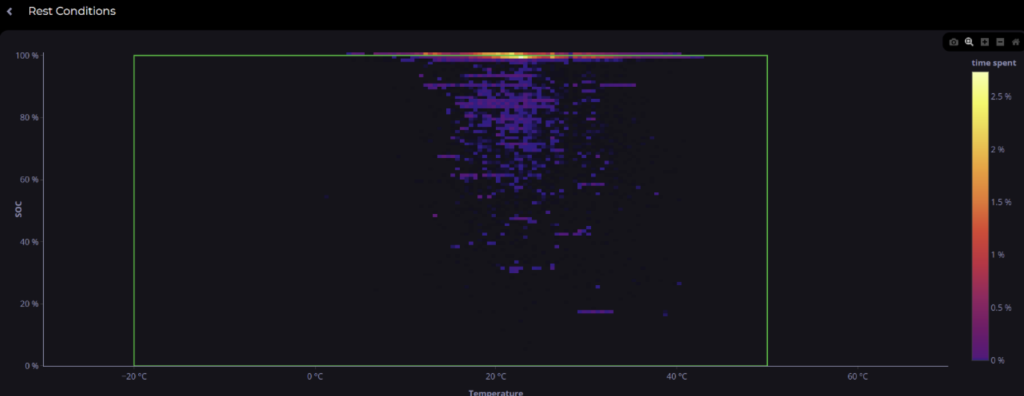
Rest conditions at 100% SOC

Figure 3: Rest conditions at 100% SOC

While warranty conditions (materialized in the image above by a green rectangle) are generally met this representation of the usage shows a clear majority of rest time spent at 100% SOC, not an optimized level to preserve battery life for the considered ebus.

4.2 State-Of-Safety: Early Indicators Upstream of Thermal Runaway

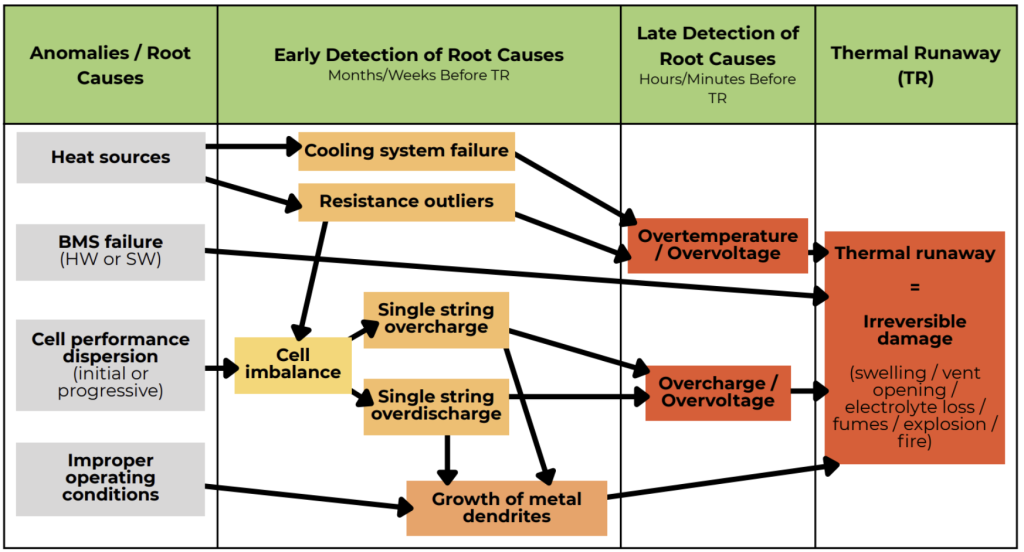
The State-of-Safety (SoS) category covers the conditions that, left to develop, can progress toward thermal runaway. The diagnostic framing distinguishes early-stage root causes (cooling failure, resistance outliers, cell imbalance, improper operating conditions, BMS measurement issues) from late-stage triggers (overvoltage, overtemperature, overcharge, overdischarge, internal short circuit). The intent of the analytics is to surface the early-stage indicators on the timescale of weeks or months, before the late-stage conditions would lead the BMS to a protective shutdown.

Figure 4: Anomalies and their root causes and how they lead to issues, and if unaddressed, thermal runaway (TR)

Safety alarms are reported at three levels: Nominal, Malfunction, and Critical. Nominal indicates safe operation. Malfunction flags conditions where targeted maintenance and energy-loss limitation are recommended. Critical indicates conditions where prevention of thermal runaway is the priority. The level structure gives operators a triage language that maps to operational decisions.

Within State-of-Safety, the audit tracks specific alarm conditions:

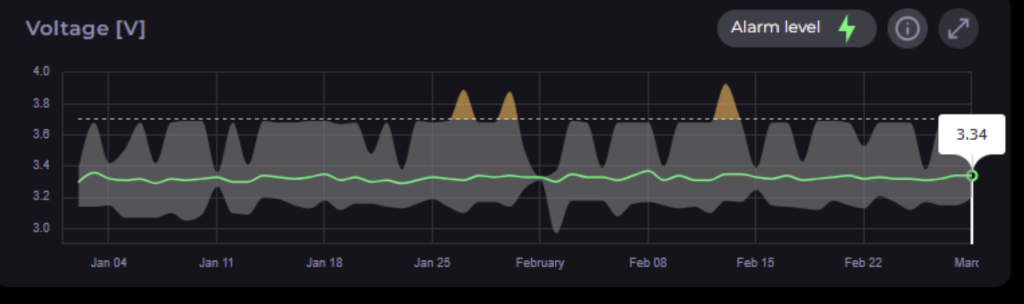
Over-voltage, under-voltage, and over-temperature are the conditions that BMS protections respond to at their trip thresholds. Tracking these as alarms in their own right, with the Malfunction level set below the BMS threshold, gives operators a window to investigate before a shutdown is forced. In one electric bus fleet examined under this framework, eight buses showed over-voltage events at the Malfunction level, none at Critical but nearly hitting the 4V mark as highlighted in the below illustration.

Each Malfunction-level event surfaced ahead of a BMS trip is an investigation conducted in a maintenance bay rather than on the side of a route, and a service shift retained on the schedule.

Eight buses showed over-voltage events at the Malfunction level

Figure 5: Eight buses showed over-voltage events at the Malfunction level

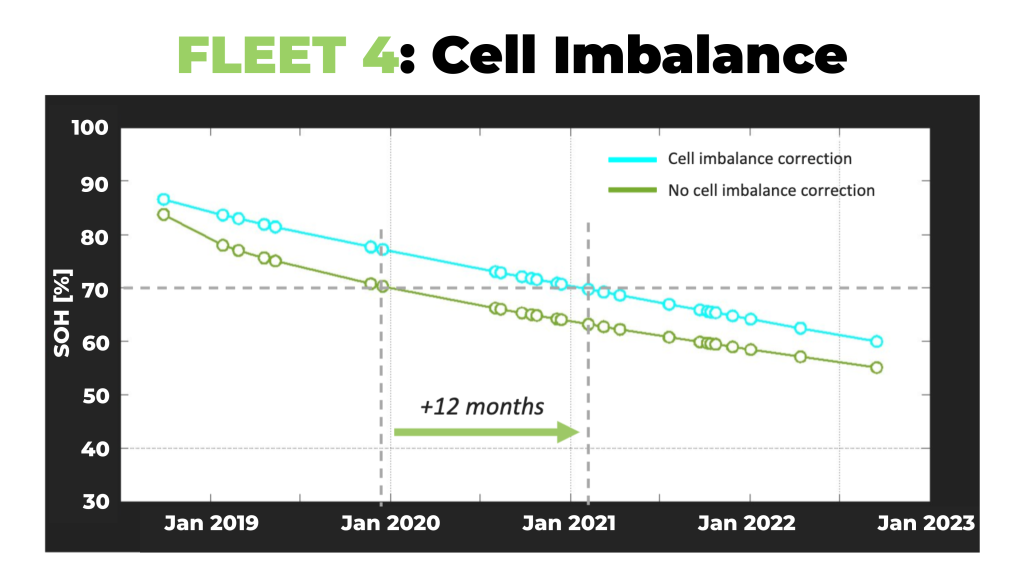
Cell imbalance is one of the most operationally consequential Safety alarm conditions. Imbalance constrains the usable operating window of the pack, accelerates ageing of the weakest cells, and, if left to develop, can compromise safe operation. It is also one of the conditions where earlier visibility creates the most value, because intervention is possible while the condition remains potentially reversible.

Fleet cell imbalance from an audit

Figure 6: Analysis of a fleet of e-buses (LFP batteries)

A PowerUp analysis of an LFP electric bus fleet in 2023 estimated an approximate 12-month service lifetime gain when dynamic cell imbalance correction was applied, relative to a comparable case without correction. Twelve additional months of service per asset compounded across the fleet is deferred replacement capex and preserved residual value.

4.3 BMS SoC Deviation

The State-of-Charge (SoC) reported by the BMS is the value the operator sees, plans against, and dispatches against. When it diverges from the true SoC, the consequences are operational rather than abstract. Vehicle or vessel displays show a charge level the battery does not actually have. Range and trip planning become unreliable. Unexpected stops or service interruptions become more likely.

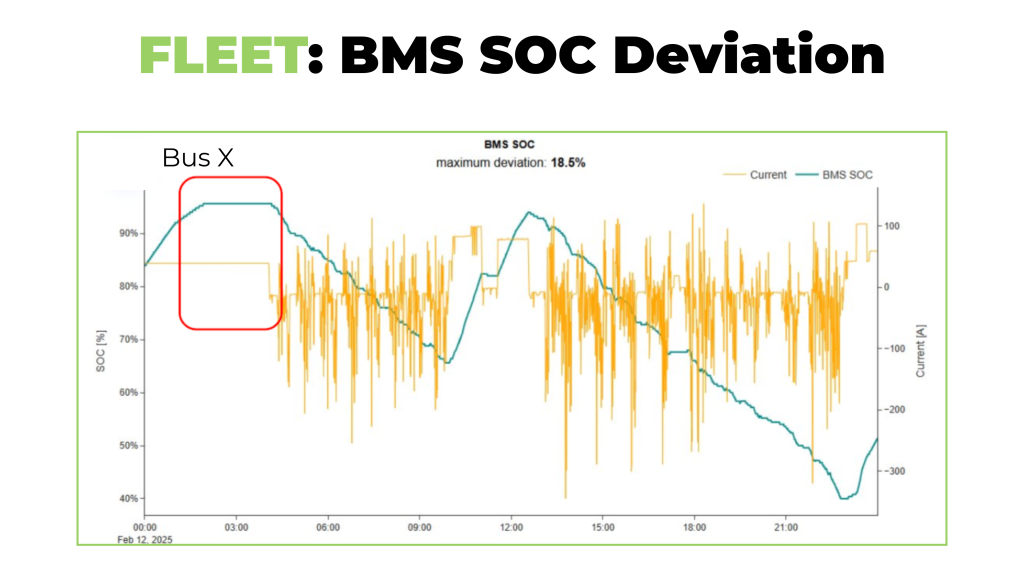
The audit tracks SoC deviation by comparing BMS-reported SoC to an independently computed value. Three levels apply: Nominal (deviation below 10%), Malfunction (at or above 10%), and Critical (at or above 20%). In a representative case from a bus fleet, an asset whose BMS read 100% SoC continued to accept charge current for several tens of minutes, indicating the BMS was off by more than 15%. In that case, a vehicle display showing 20% remaining charge could correspond to as little as 5 to 6% actual capacity, which materially increases the risk of unexpected stops without adequate warning to the driver or dispatch.

Figure 7: Illustration for Bus X where SOC BMS was off by more than 15% despite SOC BMS at 100% charging at constant current for tens of minutes

Recurring SoC deviation is typically addressed through BMS recalibration. The audit identifies which packs are affected and at what level so the recalibration is targeted. The corrective action is a software intervention rather than a hardware one, and each instance where targeted recalibration heads off an unexpected stop is a route held, an emergency recovery not dispatched, and a rider experience that does not degrade.

4.4 Internal Resistance

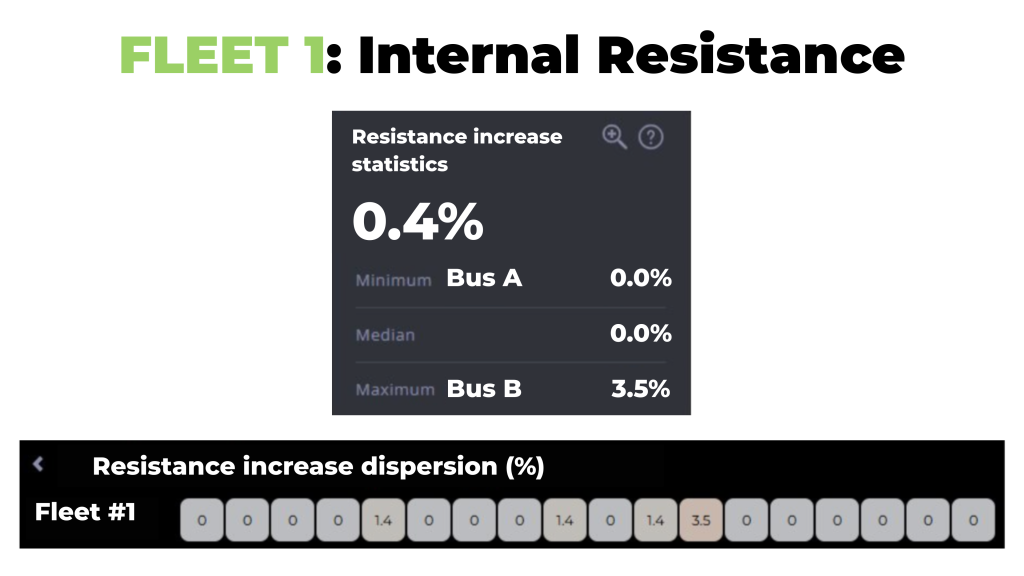
Internal resistance is tracked as a percentage relative to a fleet-wide reference value, computed from the median of all calculated resistance values over an initial period. Minimum, median, and maximum resistance are reported at the lowest hierarchical level the data supports.

Figure 8: Resistance of battery per bus for a fleet. Each tile indicates a different bus.

Resistance trends provide diagnostic information that capacity-based KPIs alone do not. They help distinguish ageing-driven degradation from issues related to electrical connections, and they surface hot spots that have implications for safety as well as performance. Distinguishing the two redirects maintenance spend from module replacement, which is materially expensive at the pack scale, toward targeted connection work, which is not.

4.5 State-of-Health

Rectangle 5, TextboxRectangle 5, TextboxState-of-Health (SoH) quantifies usable capacity relative to the cell’s nominal capacity. The estimation is computed from operational data without requiring service interruption for dedicated capacity tests. Accuracy is validated against lab and field capacity tests at approximately ±2.0%.

SOH for a fleet

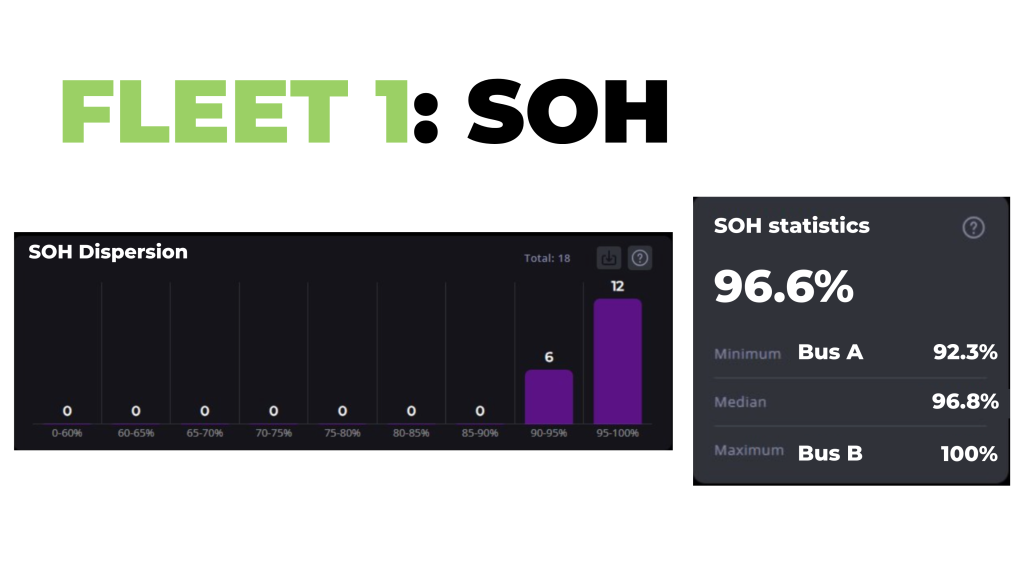
Figure 9: Global overview of Fleet level SOH, identifying that SOH value is good considering the age and usage of the system (5+ years old for this mobility application).

SoH is reported at fleet, OEM, vehicle or vessel, and pack level (and even modules when corresponding data are available). The dispersion across these levels is often more informative than the fleet average. In one electric bus fleet at approximately five years of operation, SoH averaged around 90%, with vehicle-to-vehicle dispersion reaching as much as 8 percentage points.

That kind of dispersion is operationally actionable: it tells dispatchers which buses can carry the longest routes today and which should be assigned closer to the depot, rather than relying on calendar age as a proxy.

4.6 Remaining Useful Lifetime

Remaining Useful Lifetime (RUL) projects forward from current SoH along an ageing model parameterized by the actual usage profile. Predictions are updated each time a new SoH diagnostic point is available, which keeps the projection responsive to changes in service patterns.

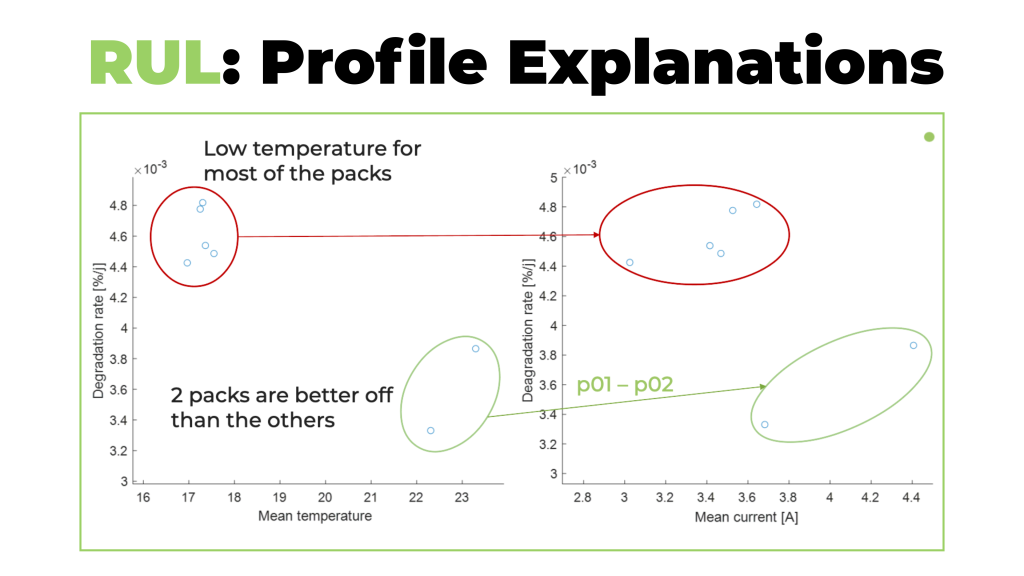
Figure 10: RUL profile and their respective explanations.

End-of-life was set at 80% SoH in this framework. Within an audit, RUL is reported as a distribution across the fleet rather than a single number. The dispersion of RUL values reflects the dispersion of starting SoH values and of operating conditions, particularly average temperature, which is one of the strongest determinants of ageing rate, together with the SoC, as a second predominant aging factor. RUL can also be simulated under hypothetical service profiles, which supports procurement and service-design conversations grounded in observed behavior rather than nameplate assumptions.

In two fleets audited under this framework, RUL projections came in at 15 years or more against an underlying contract term of 10 years. That gap is residual value: an asset projected to outlive its contracted term delivers far more revenue over the additional years.

5. What Earlier Visibility Is Worth to a Fleet Operator

When the data path, parameter set, cleansing layer, and diagnostic framework are in place, advanced analytics can surface battery conditions earlier than threshold-based BMS protections would. This does not replace those protections. The BMS is essential, and a shutdown driven by it is the correct response to the information the BMS has at the moment of the event. Advanced analytics extend the information available before that moment. The value of that extension shows up across a fleet’s economics:

Service Life Extended Through Cell Imbalance Correction

Dynamic cell imbalance correction was estimated to add an approximate 12-month service lifetime gain in a 2023 PowerUp analysis of an LFP electric bus fleet. Across a fleet, twelve additional months per asset is deferred replacement capex and preserved residual value.

Usable Capacity Unlocked Through BMS Reconfiguration

In one fleet audited under this framework, BMS configuration troubleshooting was identified as the path to unlocking approximately 5% of additional usable capacity. The correction was a software change to the BMS reference, and the gain showed up in the operator’s existing fleet without any new procurement.

Warranty Position Strengthened Through Usage Documentation

Operating conditions tracked against OEM-recommended ranges and warranty thresholds produce the documentation needed to anticipate and defend warranty conversations. In two fleets examined under this framework, C-rate exceedance against the C/3 threshold logged at approximately 10% and 1% of operating time respectively, a meaningful difference where warranty terms reference C-rate.

Residual Value Defended Through RUL Projection

In two fleets audited under this framework, RUL projections came in at 15 years or more against an underlying contract term of 10 years. An asset projected to outlive its contracted term has refinancing and resale options that a calendar-aged battery does not.

Dispatch Reliability Protected Through Targeted Recalibration

Where SoC deviation degrades trust in BMS readings, a fleet audit identifies which packs need recalibration. The alternative is what one observed case looks like: a vehicle whose display reads 20% remaining charge while actual capacity sits at 5 to 6%, which translates directly into unplanned route disruptions and emergency recoveries.

None of this eliminates risk, overrides safety systems, or removes the need for operator judgment. Instead, it changes what the operator knows and when they know it, which is the lever that connects battery data to fleet economics.

Turning Battery Data Into Fleet Economics

For an electric fleet, the battery is the engine. Its behavior shapes service planning, charging strategy, maintenance budgets, and the residual value of the asset.

Getting useful insight out of that battery depends, in order, on:

  1. Data access through whichever telematics path the operator and OEM agree to, with a clear-eyed view of what each path includes and excludes. 
  2. Data specification that names the parameters analytics actually need, before the contract is signed rather than after. 
  3. Open standards, whether TiGR in road transit or the equivalent frameworks in maritime and rail, which keep the data layer portable and the analytics layer competitive. 
  4. A cleansing and processing layer that handles volume, instrumentation noise, and communication gaps before any diagnostic algorithm runs. 
  5. A diagnostic framework that organizes output into data baseline, safety, performance, and endurance KPIs, each reported at the level of granularity the data supports. 
  6. Operator action informed by that framework, while the BMS and the rest of the asset’s on-board protections continue to do the work they were designed for. 

The fleet operators who get the most out of battery analytics are the ones who treat data conversations as part of the procurement and operations strategy.

Share this content:

Building Reliable Battery Analytics from Real-World Telemetry: The Role of Pre-Processing and Post-Processing
Previous Post
Building Reliable Battery Analytics from Real-World Telemetry: The Role of Pre-Processing and Post-Processing